One Dashboard for Your Entire Online Store Business
Integrate sales, marketing, and stock data from all your channels—Shopee, Tokopedia into one centralized database. Get a complete business overview to make smarter and more profitable decisions.

Running an Online Store Can Be Very Complex…
You know data is key, but every day you deal with:
Manual Excel Reports
Tired of downloading sales and ad report files from Shopee Seller Centre every day/week?
Wasted Advertising Costs
You spend your budget on ads, but are not sure which ads actually generate sales and which ones are just burning money?
Chaotic Stock
Difficulty predicting which products will run out soon or which have been piling up in the warehouse for too long?
Directionless Price War
Confused about when to offer discounts and for which products, without damaging your profit margins?
Introducing: Toba Data Dashboard for Online Stores
We connect directly to your Shopee and Tokopedia accounts and transform complex transaction data into easy-to-read visual insights. All your critical data, from sales to advertising, is presented in a single, interactive, and always up-to-date screen.

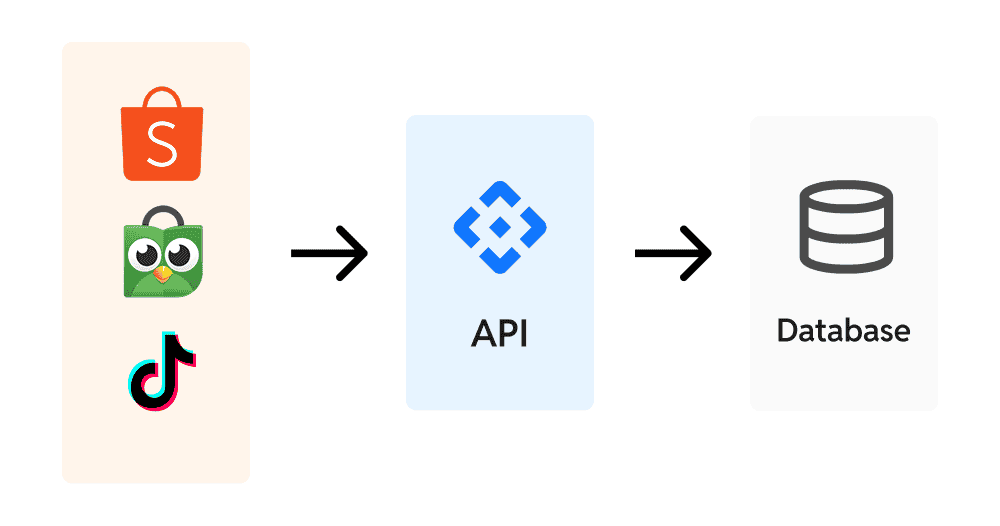
Direct & Secure API Integration
We connect directly to your Shopee Seller Centre backend via official API (Application Programming Interface). This is a fast, stable, and most importantly, secure data bridge.
Forget Manual Uploads
No more downloading and uploading .csv or Excel files. Data flows automatically to your dashboard, saving you time every day.
Guaranteed Accurate Data
Because data is pulled directly from the source, the risk of human error like copy-paste mistakes or formula errors becomes zero.
Fast & Easy Setup
Our team will guide you through a secure, one-time authorization process. In no time, your data will start synchronizing.
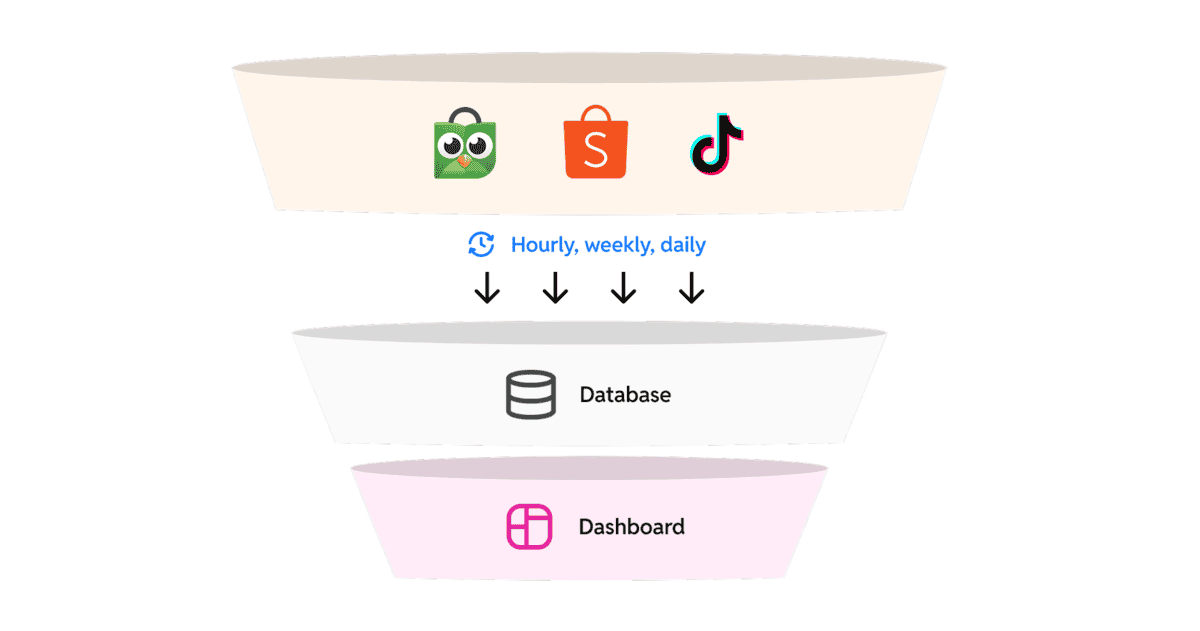
Automatic Data Updates
Your dashboard is not a static report. Our system works in the background to pull the latest data from all your channels every morning, even before you start your workday.
Decisions Based on Latest Data
Create strategies based on yesterday’s sales performance, not last week’s data.
Save Dozens of Working Hours
Allocate your team’s valuable time to analysis and strategy, not to the administrative work of collecting data.
Monitor Campaign Performance on Time
See the impact of your promotions or ad changes the very next day, allowing for faster responses.
Interactive Visualization & In-Depth Analysis
Change the way you view data. Our dashboard allows you to “play” with data and discover hidden insights.
Dynamic Filters
Want to see sales performance only for specific product categories during the 10.10 campaign? Simply click a few filter buttons, and all charts will adjust instantly.
Drill-Down for Details
Click on the monthly sales chart to see weekly breakdowns, then click again to see daily data, down to the individual product SKU.
Sortable Tables
Sort products by highest sales, lowest margin, or worst reviews to find where you should focus your attention.
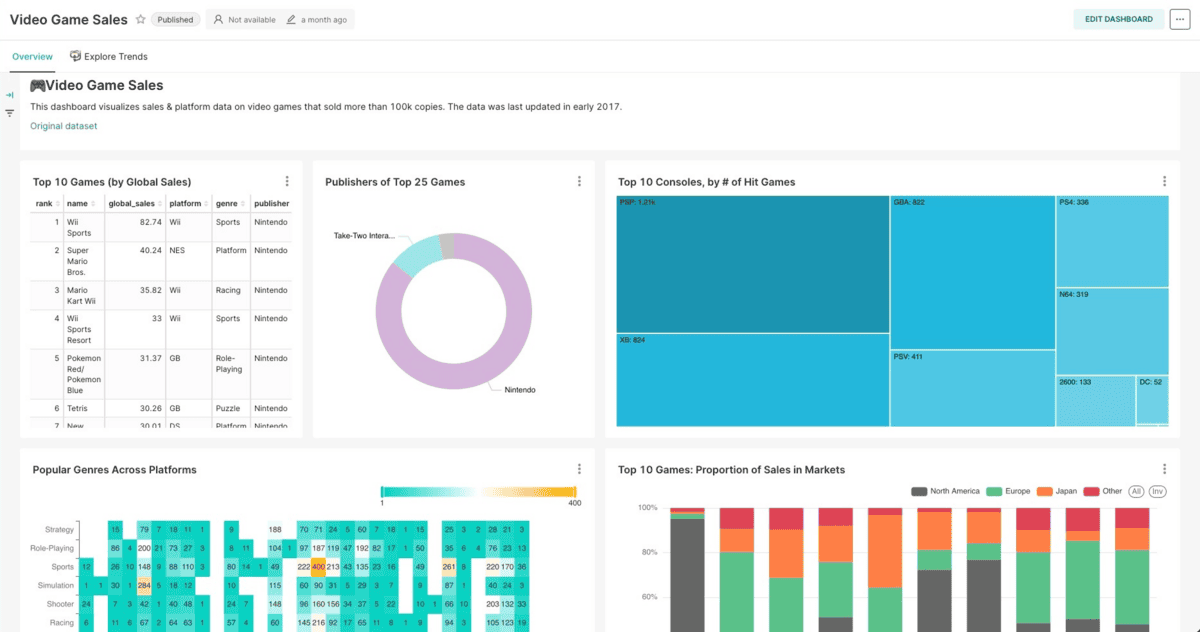
Ready-to-Use Dashboard with Most Important E-commerce Metrics
You don’t need to be a data analyst to understand your business. We have prepared all the key metrics you need in a single view.
Sales Analysis
Track metrics such as Gross Revenue, Total Orders, Average Order Value (AOV), and Best Selling Products.
Profitability Analysis
Monitor Gross Profit Margin per product and per category to ensure every sale is profitable.
Marketing Analysis
Measure ad effectiveness with ROAS (Return on Ad Spend), Cost per Order (CPO), and Click-Through Rate (CTR).
Customer & Operational Analysis
Understand visitor behavior with Conversion Rate, and keep store health in check by monitoring Cancellation Rate and Shipping Speed.
Multi-Platform Access, Anywhere, Anytime
Business doesn’t stop when you are away from your laptop. Our dashboard is designed to be accessible from any device.
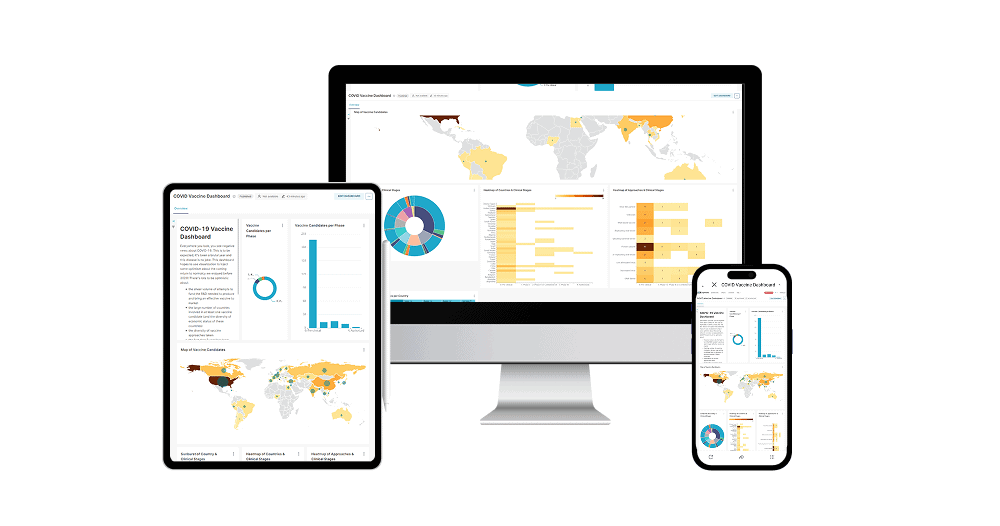
Monitor Business from Anywhere
Check morning sales performance from your tablet or monitor ad results on the go via smartphone.
Share Access with Your Team
Give read-only access to your store manager or marketing team so everyone works based on the same data.
Responsive Design
The dashboard will automatically adjust its view to remain optimal and easy to read on desktop, tablet, and smartphone.
Modify Views with Drag & Drop
Every business is unique, and your dashboard should be too. We give you complete freedom to arrange the layout, choose metrics, and build the view most relevant to you. All can be easily done via drag-and-drop interface—no coding required at all.
Focus on the Most Important Metrics
Place daily revenue charts or ad ROAS at the very top. Arrange your dashboard according to your priorities, not ours.
Sleek and Relevant View
Only care about sales and ads? Hide operational metrics you don’t monitor daily. Create a clean view free of data ‘clutter’.
Freedom Without Needing the IT Team
Want to add new visualizations from available data? Simply drag and drop new widgets onto your canvas. You have full control without waiting for technical help.
Get Answers, Not Just Data
With our Online Store Dashboard, you can answer crucial questions with a single click:
Sales & Store Performance Analysis
Which products are this week’s best-sellers?
How are my daily revenue trends, especially during campaign events (9.9, 10.10, etc.)?
What is the average order value (AOV) per customer, and how can it be increased?
How does this month’s store performance compare to last month?
Ad & Marketing Analysis
What is the ROAS (Return on Ad Spend) of each of my ad campaigns?
Keyword Ads or Discovery Ads, which is more effective at bringing in sales?
How much marketing cost do I incur to get one order?
Which products are viewed the most but purchased the least?
Visitor & Operational Analysis
What is my store’s conversion rate (from visitors to buyers)?
Which products frequently receive poor reviews from customers?
How is the shipping speed performance and order cancellation rate?